MARKET PROFILE EDUCATION SERIES
This is a test TikTok. I will be starting the Market Profile Education series soon
@trenddaytrading Range extension coming up #marketprofile #daytrading ♬ original sound - Trend Day Trading
Market Profile Education Series #1- Value Area and the Bell Curve
@trenddaytrading Market Profile Education Series - #1 Value Area and the Bell Curve #marketprofile #daytrading #futurestrading ♬ original sound - Trend Day Trading
This is part one in my market profile education series covering value area and the bell curve.
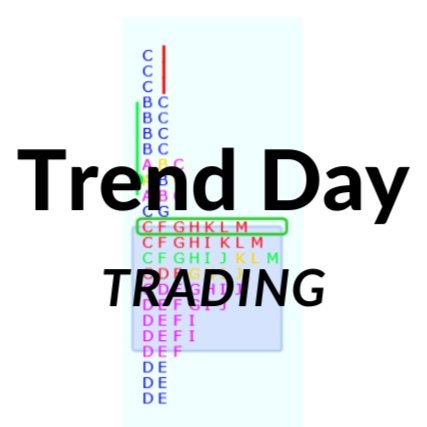
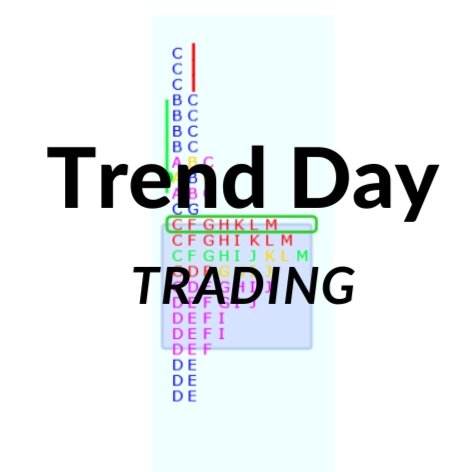
This is a typical market profile chart. You can see it looks like a sideways bell curve. The letters represent 30 minute time periods and are called TPOs. If a price is traded during a TPO time period, a letter is plotted to the right of it. At the end of the day the resulting dta series often looks like some version of the bell curve. They can look much different of course and I will cover that in future videos.
The square outline contains one standard deviation of these data points and its what is called the value area. It represents the area deemed most fair by buyers and sellers over the course of the session.
Follow me for a new market profile topic every day.
Market Profile Education Series #2- Point of Control
Market Profile Education Series number 2- Point of Control
This is a Market Profile chart from yesterday. This particular software colors the TPOs green for the Point of Control or POC. It is defined as the price level that has the most TPOs. You can see it in this chart at 18295. The POC often acts as a magnet for prices since it is viewed as a fair price more than any other price. There are three types of POCs that are relevant. First you have the emerging POC for the current day. The second POC is yesterday’s POC. Finally we have old POCs that were never revisited. These are called Naked Point of Control or NPOC. All these types are valued as targets.
Market Profile Education Series #3- Balance
Market Profile Education Series number 3-Balance
The concept of balance comes up a lot when studying market profile. The market is always trying to get into balance. Either on a day by day frame or over the course of several sessions.
Market Profile Education Series #4- Types of Market Profile Traders
@trenddaytrading MPES no4 - Types of traders #daytrading #daytrader #marketprofile #futurestrading ♬ original sound - Trend Day Trading
In the initial Market Profile documentation, J Peter Steidlmeyer split market participants into two distinct types of traders: day timeframe traders (STF) and other timeframe traders (OTF)
Day timeframe traders, or short term traders, are scalpers, day traders, and other short term players. They are flat to begin and end the day and don't take positions large enough to move the market. They provide liquidity and much of the trading in the value area.
The other group of traders is the Other Time Frame (OTF) trader. OTF traders take initiative action to push the market into range extension up or down. Or when the price moves to what OTF traders perceive as too far away from value, they take responsive action, pushing the market in the opposite direction and forcing weaker players to scramble to get out. In short, OTF traders determine the movement of the market. It is crucial to know where and when these traders are active.
Market Profile Education Series
#5- Trading the open part 1
@trenddaytrading MPES no5 - Trading the open 1 #marketprofile #daytrading #daytrader #futurestrading ♬ original sound - Trend Day Trading
The day session open gives us important market generated information. The first condition to evaluate is position of initial trade relative to yesterday’s value. It can open in value, out of value but in range or out of range. In a balanced market, with prices accepted by buyers and sellers, the open occurs inside yesterday's value. As the open continues, we see whether the market accepts yesterday's value area or breaks out of value and extends one way or the other. If the initial trade is outside value, the market is considered unbalanced. The question is whether the new territory outside value is accepted or the market moves back into balance in yesterday's value. And the final open position is when the market opens outside yesterday's range. This event is called a gap, which will be covered in more detail in a later video. So watch where it opens relative to value and how it initially reacts to the situation. Acceptance above value is bullish, below value is bearish and inside value is balanced.