Order Flow Trading and Volume At Price Analysis
Order flow charts are often called footprint charts and have become popular as a short term trading tool. They are available on many trading applications and generally show volume at a specific price during a specified time period. They can have the volume split up by volume at bid/ask or as a delta of the two. Volume at Ask signifies buying pressure and volume at bid shows selling pressure. High volume areas and low volume areas can also signify highly accepted price levels and levels where interest on one side of the market is waning. These order flow nodes are visible in a volume profile chart, which I show on most of my Market Profile charts I post. While most of my analysis is related to Market Profile, I also use volume extensively and have it up in many forms on my screens. Windotrader has some very cool volume visualizations. here are a couple examples:

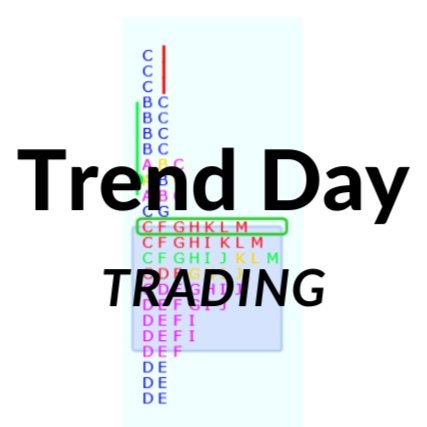
Here is an order flow chart with a Market Profile on the left, a volume profile on the right and volume bars in between.

Order flow footprint chart
There are numerous ways to view volume in your charts. These are just two examples that I happen to like. Volume, of course, represents interest. When the buyer and seller are active at the same price, you get wide Market profiles and wide volume profiles. These are accepted prices and they sort of act like magnets for activity. Low volume areas, on the other hand, signify areas where either buyers or sellers are not interested. Prices at these areas are repelled as one side has all the interest and the market moves quickly away to higher volume areas that represent fair value
Order flow is also very useful for very short term trading. When you track the volume footprint chart, you can look for high volume nodes that move the market. When a move is moving strongly, it is usually with high volume. The move dries up when volume dries up. Additionally, you can see when strong buying is happening when all the volume is on the offer. Same goes for trading on the bid. Obviously the sellers think the price is too high, even on the bid. When the majority of trading is done on one side of the market, large portions of market participants think the price is unfair, and therefore the price changes. Seems logical, right?
Some traders like to look at the orders that are at the bid and offer. There is something to learn from when orders get flashed or pulled. Most of the order book is fake orders but by watching when the orders are advertised and when they get pulled you can decipher maybe what the spoofers are doing. One of the first things to happen when electronic trading took off was traders putting in large orders to make it look like one side of the market is robust, only to pull the size at the last minute. This is called spoofing and is supposedly illegal though it happens frequently now and participants are rarely fined by the exchanges. I do subscribe to the whole order book but I don’t trust that the orders are legit. It’s all a matter of preference, some people like to see the orders I guess. To me, orders are a way to advertise your opinion, and large directional traders try to do the opposite of this,. They want to be invisible so they don’t move the market when they enter or exit their positions.
Volume, on the other hand, is real. Seeing where and when volume occurs can be a valuable tool. Try to find your favorite way to look at it. For the purposes of this work, I will primarily cover volume at price (footprints, volume bars, volume profile). I don’t value volume at time as much but it is real too and it can be useful. Volume by day, for example, is a volume at time that matters. High volume days are more important than low volume day and when you analyze a day type, higher volume signifies higher conviction. High volume price areas and low volume areas, as seen in volume profile and various footprint formats, are more useful to me. Volume by price is more telling and leaves more clues. I want to see when and at what price other timeframe participants are active. I will often reference volume and OTF traders in my playbopoks and analysis.
This is far from an exhaustive study on volume analysis but I hope you got something out of it. Follow along with our products and you will begin to see what I mean with determining reference point prices.