Volume Profile Trading: Theory, Analysis and Application
What is the volume profile and how does it play into the philosophy of this site? Volume profile is similar to Market Profile in that they are both statistical bell curves, but what is plotted is different. On a day timeframe, they often look indistinguishable. But while the Market Profile is a dynamic database of time at price, volume profile is representative of volume at price. I use it as a companion to Market Profile and I have it on many of my charts. In the chart to the right of this you can see the volume profile in red on the right side of the chart. It is reversed so it grows to the left with more volume. A lot of people like to set it up like that, be it overlayed on a Market Profile chart or a bar, candlestick or footprint. This particular one is a cummulative profile, meaning it is an aggregate of how ever many days you set it for. In this chart it is a a month. So the further left the red bar goes at each price represents the volume traded at that price. each price level can be referred to as a node. There are books written on the volume profile but you can see what it means in general. The wide nodes are the most accepted prices, where buyers and sellers agree on value. Low volume nodes offer no resistence from one side of the market. In my work I conclude that wide nodes are like magnets for price, often seeing the market go towards the node. Low volume nodes are the opposite. Prices are rejected at these levels due to one side having much more conviction. Low volume nodes are good for seeing reversal levels.
Put the volume profile up on your charts and see if it appeals to you. I find its a nice companion to Market Profile and I mention it often in my playbooks and live texts.
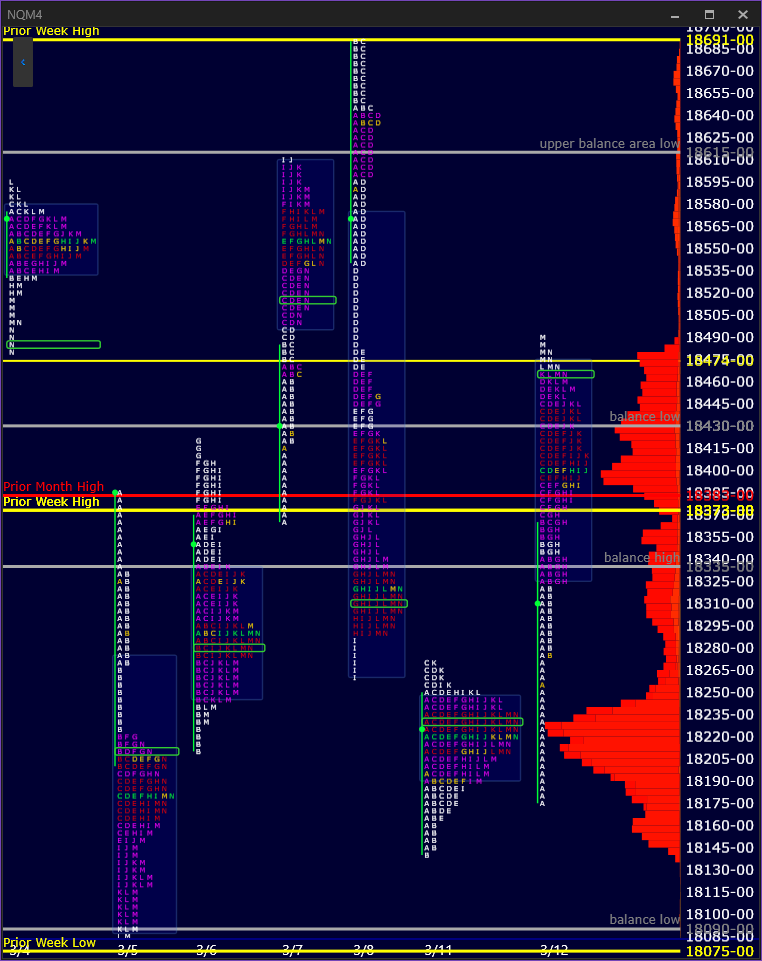
Chart by Windotrader