Market Profile Trading: Theory, Analysis and Practice
The Market Profile is a dynamic decision support tool that presents price, time, and volume in a unique and intuitive way. Proper interpretation of the data leads to more informed decisions and higher probability trades.
Market Profile does not call to buy or sell immediately. Market Profile trading is all about being ready for any move. Whether the market rallies up or sells down or just stays in a range, the idea is that you are ready for anything. Use the lessons in this guide to get to know Market Profile and see how its lessons play out on a daily basis. Its timeless and can be applied to any market.
Introduction to Market Profile Trading and the Auction Market
The Market Profile chart was invented in the 80s by Peter Steidlmayer, a CBOT Director at the time. in 1985 the CBOT Market Profile Handbook was published. Steidlmayer used the Gaussian Distribution (bell curve) as the basis for a new way of organizing and presenting the market data. Forty years later the principals hold up. Many people are scouring the internet for the latest system or YouTube guru. Most of these fads don’t work, if any do at all. Market Profile is not a foolproof system. Its a way to interpret the data and capture higher probability trading decisions.
The Market Profile is essentially a continuous auction. It moves up and down in order to facilitate the most trade, eventually settling into the area where buys and sellers agree. This is what is known at the value area.
Value, tails, POC and balance

In the original Market Profile documentation, Steidlmayer split market participants into two distinct type Market Profile traders. There are Day Timeframe traders,(DTF or Short Time Frame traders) such as scalpers, day traders and other short term players. They are flat at the beginning and end of every day and don’t take large enough positions to move the market. They provide liquidity and much of the trading in the value area. The other group of participants is the Other Time Frame traders(OTF or Long Time Frame traders) who take initiative action to push the market into range extension up or down. Or when the price moves to what OTF traders perceive as too far away from value they take responsive action, pushing the market in the opposite direction as weaker players scramble to get out.
Trading the Open
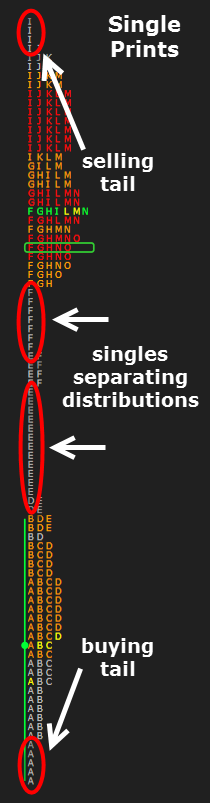
A Market Profile chart used for intraday trading is usually set up with 30 minute intervals. There is a letter added for each price a period trades at. For example, in ES, period A is from 9:30est -10:00) and period B is 10:-10:30. A letter is plotted at the price axcis. one for each distinct price. each letter is called a TPO (Time Price Opportunity).The range of the first two periods is what is known as the Initial Balance. As the auction continues throughout a new trading day more letters are plotted and the profile begins to take shape. The widest part of the profile is called the Point of Control (POC). The POC and previous POCs are important reference points. Around the POC is the value area, which is the middle 70% of TPOs. The value is an important reference for the current day and as price compares to yesterdays value area. Multiple days of overlapping value is considered a balanced market. When an opening is outside the previous days value, it is considered unbalanced until (and if) it returns to yesterdays value. At the extremes when you have single prints (one letter at a price level), it is called a buying or selling tail. The longer the tail signifies a strong response on the other side of the market and the area serves as support or resistance in the future.

Types of Market Profile traders
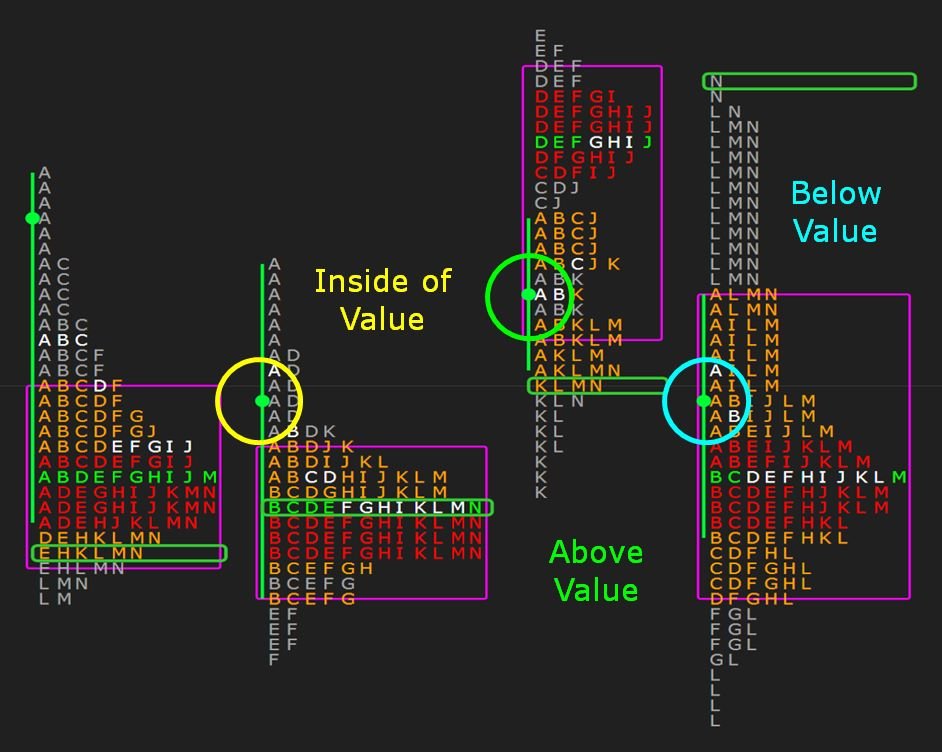
The first thing to consider about the open is how it stands vs. yesterdays value and range. It can open in value, out of value but in range, and out of range. In a balanced market, the open occurs inside yesterdays value. If outside value, the market is considered unbalanced. When open is in value, the two main reference points are yesterdays POC and yesterdays value high or low. As the open continues, we see whether the market accepts yesterdays value or breaks out of value and extends one way or the other. When open is outside of value, the question is whether new territory is accepted or the market moves back into balance in yesterdays value. When market opens outside of yesterdays range we have a gap, which is covered in detail below.
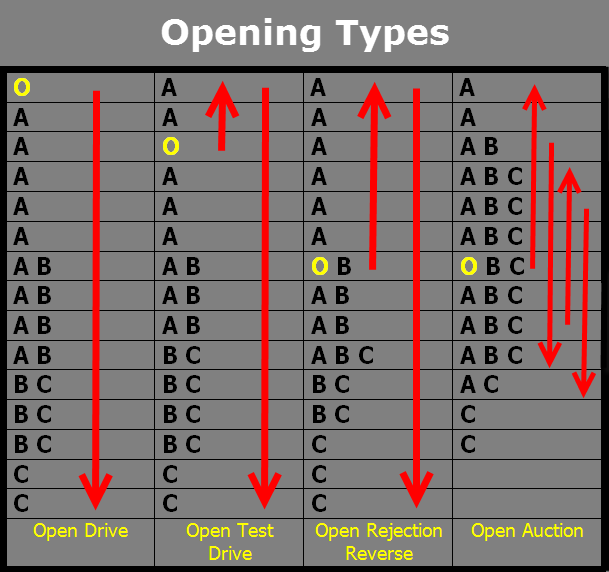
In Mind Over Markets, Jim Dalton classifies four types of opens.
Open Drive. This type of opening has the most conviction. The market opens and goes directly in one direction. In an up move there are no TPOs below the “o” which signifies the first print. In a down move, there are no TPOs above the opening print.
Open Test Drive. This is another type of opening with conviction, but the market first tests an area quickly before getting rejected and pushed strongly in one direction. The Open Test Drive will often start near a key reference point that is tested.
Open Rejection Reverse. Similar to Open Test Drive but the initial move is a little stronger. The market moves in one direction for a little longer than Open Test Drive but is met with equally strong responsive action, reverses through the opening range.
Open Auction. The Open Auction is indicative of a high level of uncertainty. The market typically opens and rotates around the open print moving above and below the first print. This continues until OTF trader steps in and moves market in one direction. Sometimes this never happens and the day just rotates in a range all day.

Gaps
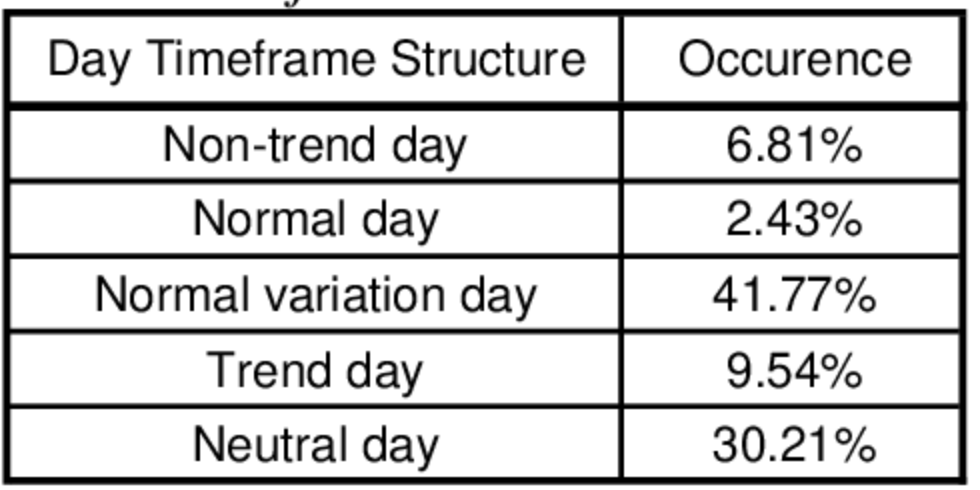
Market Profile day types can be divided into trending structure and non-trending structure. Non-trending days are much more common, accounting for around 80% of all days. Trend Days can be the most profitable and at the same time are very penak if not recognized early. You can lose a lot of money fading a Trend Day.
The four types of non-trending days are Normal Days, Normal Variation Days, Nuetral Days and Non-Trend days. Non-trending days usually have a smaller overall range than trending days and a widen POC.
Normal Day. Normal days are actually not common as the name suggests. They are actually the most rare type of day, happening only 2.43% of the time. Normal days are created by OTF traders entering the market early and from both sides. This creates a wide Initial Balance and two sided trade throughout the day.
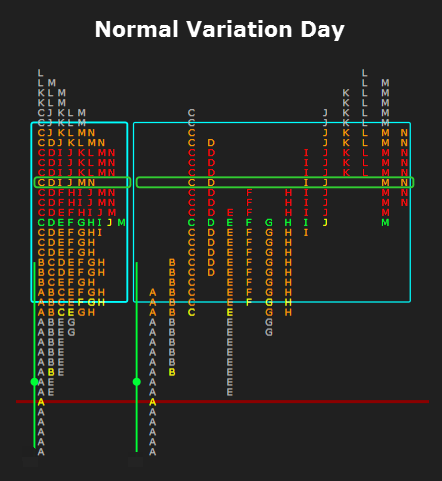
Normal Variation of a Normal Day. Normal Variation Days are quite common, happening 41.77% of the time. These days are typically not as dynamic early in the day as a Normal Day, resulting in a smaller Initial Balance. On a Normal Variation day, an OTF trader will usually enter pretty early and extend the range to one side before a responsive OTF on the other side will halt the move and a new higher or lower value area will be created.
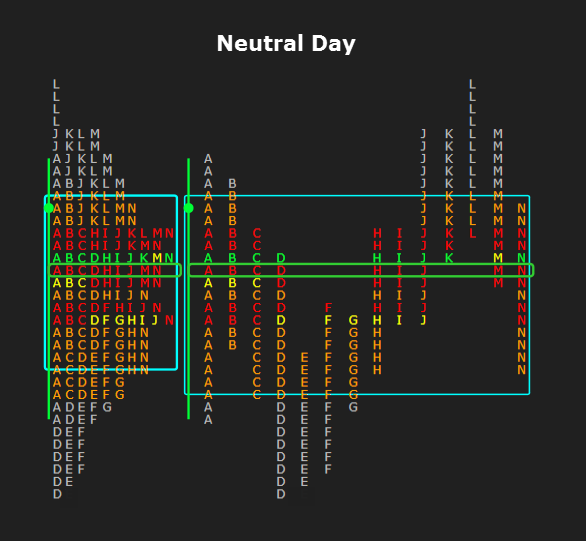
Neutral Day. Neutral Days are fairly common, happening 30.21% of the time. On a Neutral Day the OTF buyer and OTF seller are not far apart in their view of value. The fact that both are active doesn’t mean they trade with each other. Actually the OTF traders just enter at extremes and push the market back and forth with neither side really ‘winning”. Neutral Days are often sub classified as Neutral-Center Days and Nuetral Extreme days, the difference is where the market settles. A Neutral Day Extreme may signal that perceptions are changing and could continue the next day.
Non-Trend Day. A Non-trend Day is characterized by a complete lack of directional conviction. At 6.81% these conditions are fairly rare and might happen around holidays or before a big fed meeting or economic release. Activity is mainly participants flattening their positions before an event but market participation is low.
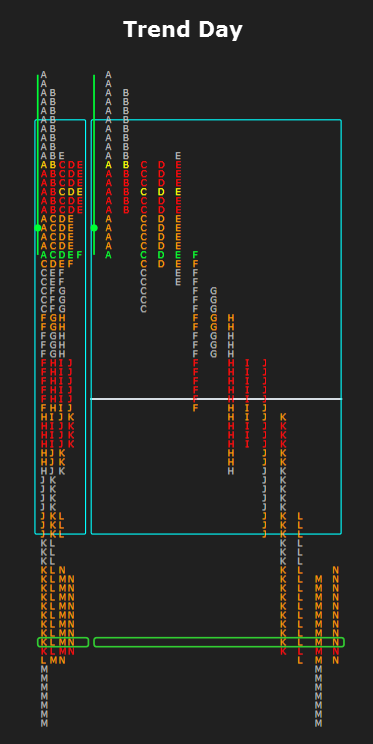
The two types of trending days are Trend Days and Double-Distribution Trend days. Together they account for 9.54% of all days.
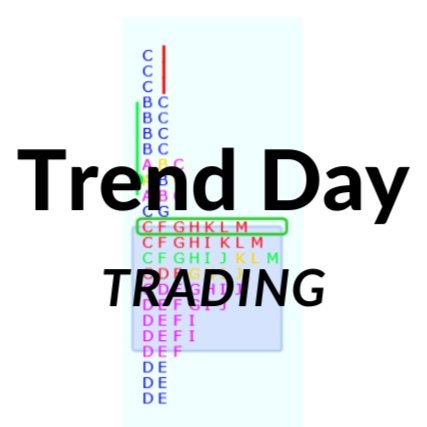
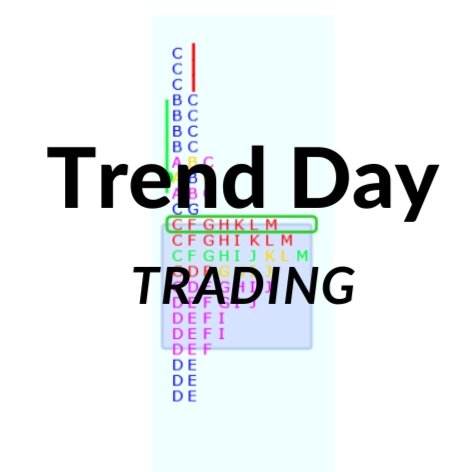
Trend day. Trend days are marked by a long skinny profile. The OTF buyer or seller, one or the other, stays in control pretty much frim the open to the close, bringing in new participants who help pressure the market further along the way. The market is said to be one-timeframing, which in an up market means consecutive higher highs and higher lows. When one-timeframing begins its an indication of OTF control and the prospect of a Trend Day. Everyone has heard, “the trend is your friend” but recognizing trend days early and avoiding fighting trhem can be critical to long term success.
Multi-Distribution Trend Day. Multi-Distribution Trend Days, more often called Double Distribution Trend Days, typically start slower with a small base and moderate activity early in the day, thus creating a mini distribution. At some point in the day an OTF trader enters aggressively and pushes activity to one side of the market, extending the range and creating at least another mini distribution at a new level and taking value to the new area. Soetimes there are three distributions or even more, but this is rare and would probably be tagged a generic Trend Day.

Single prints, anomalies, spikes, ledges and special circumstances


Excess. Excess is another name for the buying/selling tails at the extremes of the profile. A longer tail or more excess signifies a stronger responsive action from OTF traders. Significant excess at extremes shows that the auction is completed and the move is complete.
Single Prints. Single Prints are the same as excess but happen inside the profile and are simply one letter printing at a pricer level. Single prints signify low volume nodes and areas where the price moved quickly through an area. These areas are often revisited and filled up. Single print areas in the middle of a profile is called Minus Development.
Anomalies. Anomalies are non-symmetrical areas of a profile that are often “smoothed out” by new activity. They are seen as structural weakness.
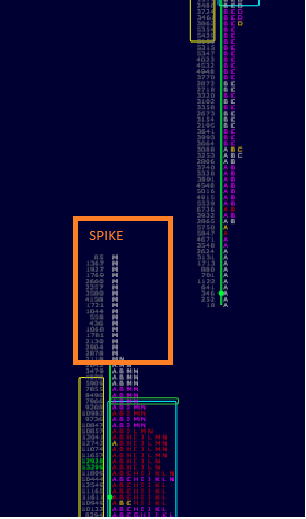
Spikes. Spikes happen when price moves swiftly away from previously established value in the last period of the day. There is no time to confirm acceptance so acceptance is delayed until the next session. If the market opens within the spike it signifies balance and acceptance of the new level. If the market opens beyond the spike in the same direction, it is treated like a gap from the base of the spike. Opening under the spiike as in where the market was before the spike it symbolizes a rejection of the spike area.
Ledges. A Ledge resembles one half of a distribution. It is an awkward looking formation that seems like it should move through that area to complete the profile. Sometimes it does, but sometimes it keeps stopping on the same ledge and when it reverses it goes quite a lot.
Poor high/low. Poor highs and lows signify a lack of excess. This signals that the auction is incomplete and will return to the area and continue until a OTF trader comes in and acts responsively, reversing the market with excess.
p and b Shaped profiles
Opening gaps occur when market opens outside of the previous range. Peter Reznicek of www.shadowtrader.net is a Jim Dalton student and has an concise set of rules for gaps.
1. Go with all gaps that don’t fill right away. If prices don’t close imbalance right away, it is likely to go with the gap.
2. Large gaps often fail to fully fill on first day. Gaps that aren’t filled remain references moving forward.
3. If gap fills but value does not move enough to overlap with the previous day, odds a a late day move with the gap increase.
4. Large gaps(>20pts on ES) are difficult to trade early as market often digests move and goes nowhere at first.
Market Structure
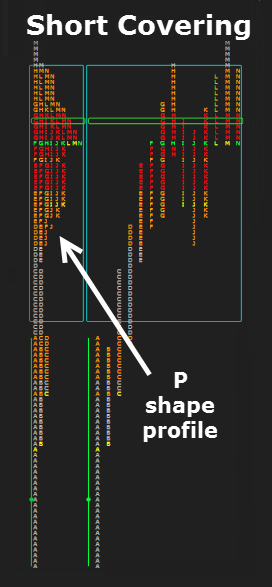
P-shaped profile.Signals a short-covering rally that starts early in the day, rallies up to a new value area and forms a distribution that resembles the letter P.
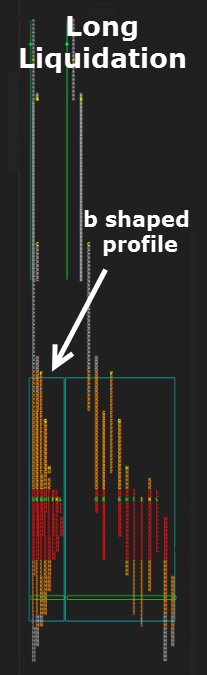
b-shaped profile. Signals a long-exiting break that starts early in the day, breaks down to a new value area and forms a distribution that resembles the letter b.
The 80% rule
This is probably the most famous Market Profile strategy developed by Jim Dalton. It proposes that if the market opens out of yesterdays value and then moves back into the previous value and is accepted (2 TPOs), there is an 80% change it fills the value from yesterday. This also works if the market opens in value but moves out of value before settling back into value. The key is that it must be accepted, meaning two distinct TPOs print there.
Volume Data Analysis
Volume is an important resource when viewing the market through Market Profile. It is the only element of information that does not rely on price action. Instead, it actually influences price action. Most people assume high volume areas are the most important, and high volume movement does indicate strong OTF conviction. But low volume areeas can also be telling, as OTF traders use this market time to probe for stops or supply/demand and certain levels.
Traditional volume study usually comes in the form of a histogram below a bar or candlestick chart. This basically shows volume expansion and contraction and can be used to confirm the substance of a move. High volume moves are more credible. As a profile trader, volume is often viewed in the form of a Volume Profile, which is similar looking to a Market Profile chart but measures volume at price. Volume Profile charts often widen out at the same price levels of the Market Profile. Wideness in either profile represents acceptance. Low volume areas in a Volume Profile are like single prints in a Market Profile. They signify rejection or a lack of opposition to a level. The Volume Profile also has a value area and a VPOC, both following the same definitions that the Market Profile points use. VPOC is often referenced as it is the most accepted price. Like the POC, the VPOC often acts like a magnet to price.
Another volume study is what is usually referred to as the Footprint chart. Footprint charts show a price ladder split at any specific time interval. At each price, volume on the bid and volume on the offer are listed like 330x125. With the first number the volume on the bid and the second number the volume at offer. The Footprint Delta is another was this chart can be set up. Instead of bidxask it just shows the delta, with a positive number signifying more trades on the offer, (bullish) and a negative representing more trades on the bid (bearish). The delta can also be a separate value either above or below a footprint chart that is using bidxask. As a bidxask configuration, trades on the ask with a larger number are colored blue or green and trades on the bid are colored red. It is useful to watch near execution areas for very short term bias. If there is a lot of red on the footprint chart it is probably going down, likewise if its blue or green the market is facing upward pressure.
Conclusion


Many people think the Market Profile is complicated and don’t bother taking the time to learn how to apply the theory to everyday trading. It is not a 100% rules based system. It is a different way of looking at the Market Generated Information that allows you to see where big players are active and where there is noise and only small traders are active. Hopefully this primer can provide a base to work from.